
Article
The trade show ROI formula (cost per qualified meeting)
One formula for trade show ROI — all-in spend divided by ICP-qualified meetings in 90 days. Worked examples by show tier with the variables finance actually asks for.

Article
Short answer: The trade show ROI formula is ROI = (Pipeline Influenced − All-In Cost) ÷ All-In Cost, expressed as a percentage. When finance wants efficiency instead of pipeline dollars, use cost per qualified meeting = All-In Cost ÷ Qualified Meetings. Both formulas share the same denominator — every exhibit line item, not booth rent alone.
When I talk to marketing leaders about their expo calendar, the question I hear most is not whether trade shows work — it is whether finance will renew the line item. They do not want a scorecard with twelve metrics. They want one equation, defined variables, and a number they can compare to paid media. That is what this guide delivers: the single trade show ROI formula, the cost-per-meeting variant, worked Tier A/B/C examples, and the CEIR benchmark that keeps your denominator honest. For debrief workflow and when to kill a show, use our separate ROI scorecard — this page is the math.
The two formulas (use one as primary)
Pick one primary metric per show and stick to it across your 2026 calendar. Mixing definitions mid-year is how teams lose budget debates.
- Pipeline ROI (budget defense): ROI = (Pipeline Influenced − All-In Cost) ÷ All-In Cost. Example: $240,000 influenced pipeline minus $40,000 all-in spend, divided by $40,000 = 500% ROI (or 5× return on exhibit spend).
- Cost per qualified meeting (show comparison): All-In Cost ÷ Qualified Meetings. Same $40,000 spend with 16 ICP-qualified meetings = $2,500 per qualified meeting.
I use pipeline ROI when the CFO asks whether the program pays for itself. I use cost per qualified meeting when comparing a Tier B regional against a Tier A flagship on the same ICP — apples to apples on efficiency, not just top-line pipeline.
Define the variables before show day
The formula only works when sales and marketing agree on inputs before move-in. Lock these four definitions in your pre-show brief:
- All-In Cost — Booth space, build or rental, freight, drayage, labor, travel, hotels, pre-show outreach, scanners, and sales follow-up hours attributed to the show. CEIR research consistently shows booth space is only 25–35% of total exhibit spend (CEIR). If your denominator is the organizer invoice alone, your ROI is fiction. Build the full number with our hidden costs checklist and all-in exhibit cost guide.
- Qualified meeting — ICP match confirmed in CRM: role, pain, and timeline captured; not a badge scan, not a student, not a competitor doing reconnaissance.
- Pipeline Influenced — Opportunity dollar value created or advanced within 90 days where the show is tagged as a source touch in CRM. Pre-booked meetings count when the show source field is set at booking time.
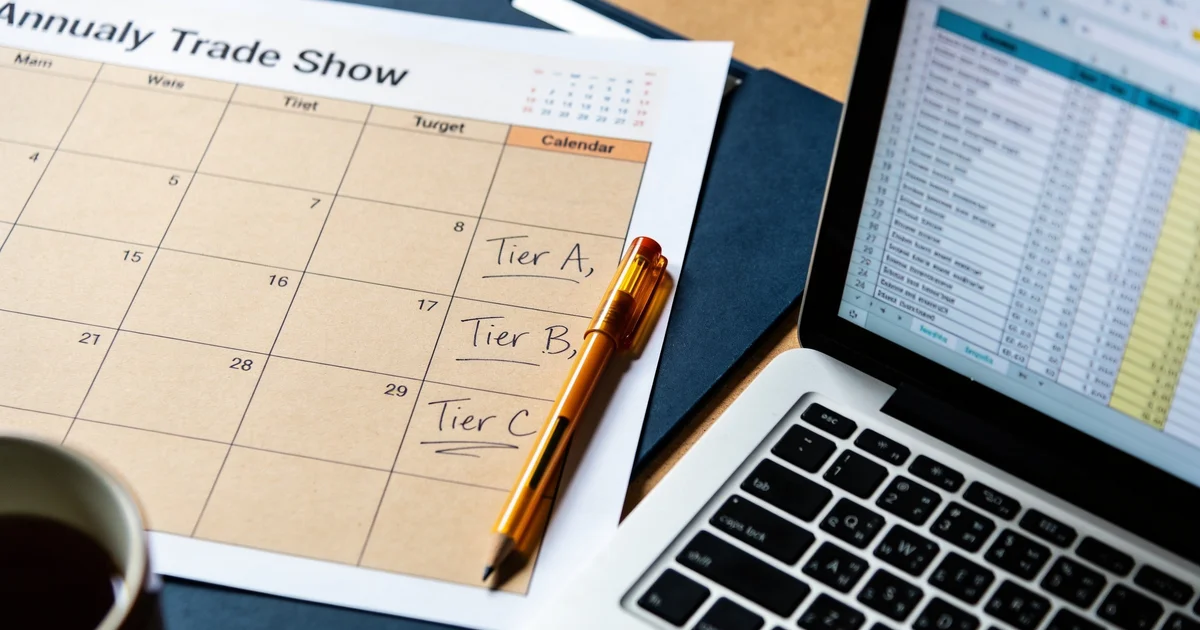
- Show tier — Tier A/B/C from our calendar framework sets expected meeting volume and all-in range — do not judge a Tier C validation booth on Tier A pipeline targets.
Worked examples: Tier C, Tier B, and Tier A
Same formula, three calendar tiers. Numbers below are editorial ranges we use in 2026 debriefs — adjust for your footprint and sector, but keep the math structure.
| Tier | All-in cost | Qualified meetings (90 days) | Cost per qualified meeting | Pipeline influenced | Pipeline ROI |
|---|---|---|---|---|---|
| Tier C (validation) | $22,000 | 5 | $4,400 | $68,000 | 209% |
| Tier B (regional) | $38,000 | 14 | $2,714 | $195,000 | 413% |
| Tier A (flagship) | $92,000 | 31 | $2,968 | $510,000 | 454% |
Read the table twice. Tier C looks expensive on cost per meeting ($4,400) but can still show positive pipeline ROI if the show validates ICP density before you scale spend. Tier A carries a higher all-in numerator — yet strong teams often land near Tier B efficiency on cost per meeting because pre-show outreach fills the calendar before doors open. Shortlist candidate fairs on ExhibitionsVoice and assign tier before you plug numbers into the formula.
Step-by-step: run the pipeline ROI formula
- Sum all-in cost — Use the line-item budget from finance, not the booth quote. Booth space should land in the 25–35% band; if it is 60% of your model, you are missing freight, labor, or travel.
- Count qualified meetings at day 90 — Export CRM with show source tag and ICP qualification fields complete. Divide All-In Cost by that count for the efficiency metric.
- Sum pipeline influenced at day 90 — Open opportunities where the show appears in source history or campaign membership.
- Apply the equation — (Pipeline Influenced − All-In Cost) ÷ All-In Cost. Express as a percentage for the slide deck.
- Benchmark once — Compare cost per qualified meeting to your paid media number for the same ICP. That single comparison ends most budget arguments.
Teams that skip step one — using booth rent as the denominator — are repeating mistake #2 in our five biggest trade show mistakes guide. The formula is simple; the discipline is in the all-in build.
When to lead with cost per meeting instead of pipeline ROI
Early-stage vendors with short sales cycles often have thin pipeline at day 90 even when meetings were strong. Lead with cost per qualified meeting until enough opportunities mature for pipeline ROI. Enterprise teams with six-month cycles may need both metrics on the same slide: efficiency now, influenced pipeline at 90 and 180 days.
Neither formula rewards badge scans. If your numerator is foot traffic and your denominator is incomplete, finance will cut the line — correctly. Fix capture and all-in modeling first; the equation takes five minutes once inputs are honest.
Formula vs scorecard — which page to use
This article is the equation. Our ROI scorecard guide is the operating system: win-rate comparison, paid media benchmarks, debrief timing, and when to kill or downgrade a show for next year. Run the formula after every Tier A and Tier B exhibit; run the full scorecard at calendar planning season.
Pre-show checklist (lock formula inputs)
- All-in budget approved with CEIR 25–35% booth-space check against total
- CRM show source field and qualification picklist live before scanning
- Primary metric chosen — pipeline ROI or cost per qualified meeting — communicated to sales
- Day-90 and day-180 pipeline review dates on calendar
- Tier A/B/C label on the show record matches calendar tier expectations
FAQ
What is the trade show ROI formula?
ROI = (Pipeline Influenced − All-In Cost) ÷ All-In Cost, expressed as a percentage. Pipeline influenced is opportunity value created or advanced within 90 days with the show tagged as a source; all-in cost is every exhibit line item, not booth rent alone.
How do you calculate cost per qualified meeting at a trade show?
Divide total all-in exhibit spend by the number of ICP-qualified meetings logged within 90 days, with CRM source tagged to the event. Qualified means role, pain, and timeline captured — not a badge scan alone.
What counts as all-in trade show cost?
Booth space, build or rental, freight, drayage, labor, travel, hotels, pre-show outreach, lead capture tools, and attributable sales follow-up time. CEIR puts booth space at roughly 25–35% of that total.
What is a good trade show ROI percentage?
Positive pipeline ROI — where influenced pipeline exceeds all-in cost — is the baseline for renewal. Compare cost per qualified meeting to your paid media benchmark for the same ICP; at or below that number usually keeps finance supportive.
Should Tier C validation shows use the same formula?
Yes. Tier C uses a smaller all-in denominator and lower meeting expectations. A positive pipeline ROI or acceptable cost per meeting tells you whether to upgrade to Tier B; a negative result saves you from scaling the wrong fair.
How is this different from a trade show ROI scorecard?
The formula is one equation with two variants. The scorecard adds win-rate comparison, benchmark tables, debrief workflow, and kill/downgrade rules — use both, but lead finance conversations with the formula first.
The two formulas (pick one primary)
Pipeline ROI: ROI = (Pipeline Influenced − All-In Cost) ÷ All-In Cost. Efficiency metric: Cost per qualified meeting = All-In Cost ÷ Qualified Meetings. Use pipeline ROI for annual budget defense; use cost per meeting for show-to-show comparison.
Define all-in cost before you divide
CEIR research puts booth space at roughly 25–35% of total exhibit spend. The denominator must include freight, drayage, labor, travel, graphics, and follow-up time — see hidden costs checklist and all-in exhibit cost guide.
Worked examples: Tier A, B, and C
Same formula, three calendar tiers from our budget framework: Tier C validation ($22k all-in, 5 qualified meetings), Tier B regional ($38k, 14 meetings), Tier A flagship ($92k, 31 meetings). Show math for both ROI % and cost per meeting.
How this differs from the ROI scorecard
This page is the equation. For debrief workflow, win-rate comparison, and when to kill a show, use the ROI scorecard guide. Avoid the mistakes that break the denominator in our five biggest mistakes list.
Common exhibitor questions
What is the trade show ROI formula?
ROI = (Pipeline Influenced − All-In Cost) ÷ All-In Cost, expressed as a percentage. All-in cost includes every exhibit line item, not booth rent alone.
How do you calculate cost per qualified meeting at a trade show?
Divide total all-in exhibit spend by the number of ICP-qualified meetings logged within 90 days of the show, with CRM source tagged to the event.
What counts as pipeline influenced?
Opportunity dollar value created or advanced within 90 days where the show is tagged as a source touch — meetings booked on-site or in pre-show outreach count when CRM fields are complete.
What is a good trade show ROI percentage?
Compare against your paid media cost per qualified meeting benchmark. Many B2B teams target positive pipeline ROI (numerator exceeds all-in cost) and cost per meeting at or below paid search for the same ICP.
Why use all-in cost instead of booth rent in the formula?
Booth space is only 25–35% of total spend per CEIR. Using rent alone inflates ROI and hides freight, labor, and follow-up — the costs that actually break budgets.
Should Tier C shows use the same ROI formula?
Yes — same equation, lower all-in denominator. Tier C is validation: a small positive pipeline ROI or acceptable cost per meeting tells you whether to upgrade to Tier B next year.
Editorial standards & corrections
This guide is maintained by the ExhibitionsVoice editorial team. We cross-check dates, venues, and organizer names against official sources before listing events. Spot an error? Use our contact form with the event URL and corrected details — every correction request is read by editorial.
Read more: About ExhibitionsVoice · FAQs · All exhibitor guides
Related articles
Oil and gas trade shows 2026: energy calendar and how to pick
Oil and gas trade shows for 2026 — ADIPEC, WETEX, and offshore energy fairs we score for NOC, IOC, and energy-tech exhibitors.

CPHI India 2026 exhibitor guide: Delhi pharma ingredients floor
CPHI India 2026 exhibitor guide for 23-25 November at IICC Yashobhoomi, New Delhi — API, CDMO, and packaging teams scoring South Asia's ingredients floor.

Fintech trade shows 2026: payments calendar and how to pick
Fintech and payments trade shows for 2026 — Money20/20 USA, Sibos, and how banks and vendors pick Tier A/B/C money-ecosystem floors.

ADIPEC 2026 exhibitor guide: Abu Dhabi energy floor
ADIPEC 2026 exhibitor guide for 2-5 November at ADNEC Centre Abu Dhabi — who should exhibit, hall logistics, and how we score the energy floor.