
Article
Trade show budget breakdown (all-in line items for 2026)
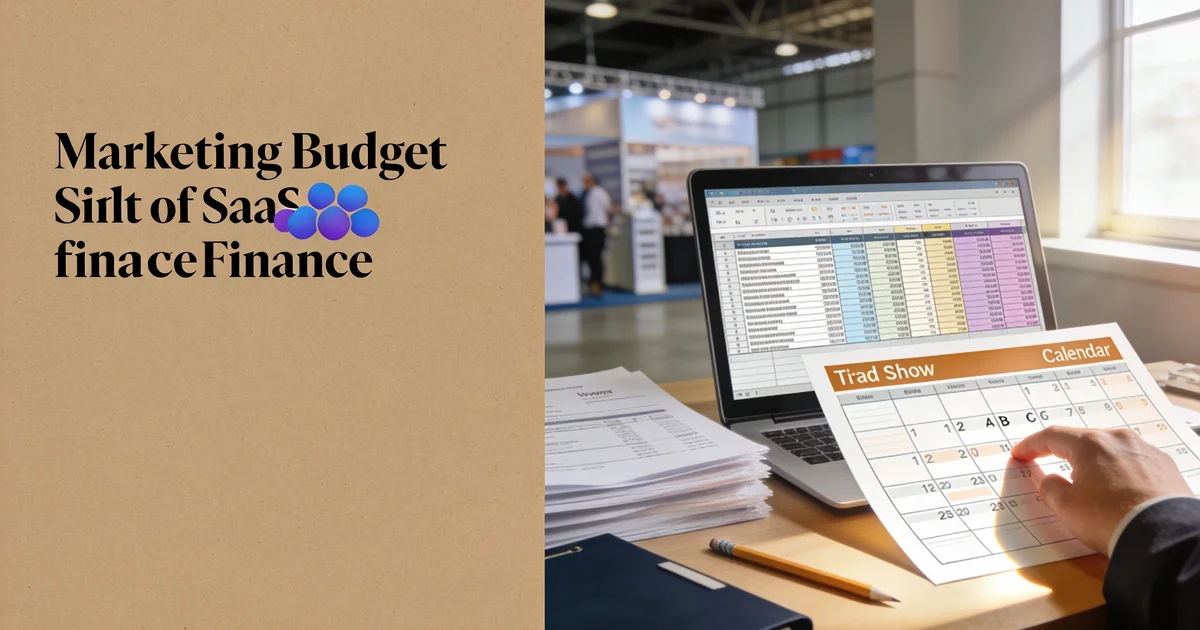
Complete trade show budget breakdown — booth space, build, freight, labor, travel, marketing, and follow-up — with percentage splits and tier A/B/C ranges.

Article
Short answer: A complete trade show budget breakdown allocates 100% of all-in spend across ten line items — booth space (25–35% per CEIR), build, freight, labor, travel, pre-show marketing, show services, lead capture, follow-up, and contingency. For a standard 10×10 footprint in 2026, plan $18,000–$28,000 at Tier C, $18,000–$45,000 at Tier B, and $50,000–$150,000+ at Tier A — then map dollars to the percentage bands below.
When I talk to marketing leaders about their expo calendar, the budget conversation breaks down in the same place every time: finance sees a booth quote, ops sees freight invoices, and sales sees travel receipts — but nobody owns one spreadsheet that adds to 100%. That is what this guide is for. It is not a booth-size comparison (see our average booth cost breakdown by size). It is not a mistake list of forgotten invoices (see our hidden costs checklist). This page is the allocation template — percentage guardrails, dollar ranges, and Tier A/B/C totals for a 10×10 — that we submit before signing organizer contracts.
The all-in budget table (line items and % splits)
CEIR research consistently shows booth space is only 25–35% of total exhibit spend. The other 65–75% is where calendars blow up — and where incomplete models hide. We use this master table for every 2026 show brief. Percentages are bands, not rigid rules; dollar examples assume a mid-range Tier B 10×10 at ~$32,000 all-in.
| Line item | Typical % of all-in | What it covers | Tier B example ($32k) |
|---|---|---|---|
| Booth space | 25–35% | Organizer square-foot rate, corner premiums, corner fees | $8,000–$11,200 |
| Build / rental + graphics | 15–25% | Walls, counters, carpet, lighting, print, I&D | $4,800–$8,000 |
| Freight & drayage | 10–20% | Inbound shipping, marshalling yard, material handling to booth | $3,200–$6,400 |
| Labor | 10–15% | Install, dismantle, rigging, union supervision, electrical labor | $3,200–$4,800 |
| Travel & hotels | 15–25% | Flights, hotels, per diem, ground transport (3–4 staff typical) | $4,800–$8,000 |
| Pre-show marketing | 5–10% | Meeting outreach, mailers, LinkedIn ads, list buys, save-the-dates | $1,600–$3,200 |
| Show services | 3–8% | Electrical, internet hardline, cleaning, furniture rental add-ons | $960–$2,560 |
| Lead capture | 2–5% | Scanner licenses, badge API, kiosk tablets, dedupe tools | $640–$1,600 |
| Follow-up | 5–10% | SDR hours, CRM admin, post-show email sequences, sample shipping | $1,600–$3,200 |
| Contingency | 5–10% | Rush graphics, relabelled crates, overtime, hotel rebooks | $1,600–$3,200 |
If booth space exceeds 40% of your model, you are almost certainly missing freight, labor, or travel — the pattern we flag in our hidden costs guide, but fix here with structure, not reminders. For headline all-in ranges across footprints, cross-check our cost to exhibit guide.
Tier A/B/C totals for a 10×10 footprint
Same footprint, three calendar tiers. Assign tier before you plug numbers — expectations for meeting volume and pre-show spend differ even when the booth size stays 10×10. Use our Tier A/B/C calendar framework to label each fair, then browse candidates on ExhibitionsVoice.
| Tier | 10×10 all-in range | What moves the number | Sample booth-space slice (30%) |
|---|---|---|---|
| Tier C (validation) | $18,000–$28,000 | Regional fair, rental booth, 2 staff, minimal pre-show | $5,400–$8,400 |
| Tier B (regional) | $18,000–$45,000 | Standard B2B show, 3–4 staff, moderate outreach | $5,400–$13,500 |
| Tier A (flagship) | $50,000–$150,000+ | Flagship hall, premium build, 4–6 staff, heavy pre-show | $15,000–$45,000 |
Tier C is where we prove ICP density before scaling spend. Tier B is the workhorse calendar slot. Tier A carries the highest travel and pre-show percentages — not because the booth is bigger, but because we run meeting campaigns and send senior sellers. If you need 10×20 or 20×20 dollar ranges, use our booth cost breakdown by size; this page keeps the 10×10 constant so percentage splits stay comparable year to year.
How to build the spreadsheet finance will approve
I submit a one-page model with three columns: category, target %, and committed $. Finance cares that the columns sum to the all-in ceiling — not that every invoice has arrived yet.
- Label tier and footprint — 10×10 at Tier B is the default first exhibit in our 2026 calendars.
- Set the all-in ceiling — Use the Tier A/B/C range above, not the organizer space quote × 1.5.
- Allocate within bands — Start with booth space at 30%, then build, freight, labor, travel, marketing, services, capture, follow-up, contingency.
- Lock contingency last — 5–10% stays unassigned until week-of surprises appear; do not absorb it into graphics.
- Attach ROI metric — Same all-in total becomes the denominator in our trade show ROI formula.
Teams that skip step three — approving booth rent first and discovering drayage in show week — repeat the same failure mode our hidden-costs article describes as separate mistakes. This template prevents that by forcing every category to exist on day one.
When percentages shift (without breaking the model)
Percentages are guardrails, not gospel. I adjust within bands when show context demands it:
- International exhibitors — Freight rises toward 20%; travel may drop if local staff run the booth.
- Union-heavy venues — Labor pushes toward 15%; show services (electrical minimums) toward 8%.
- Pre-booked meeting strategy — Pre-show marketing and follow-up each lean toward the top of their bands; booth graphics matter less than outbound calendar fill.
- Rental-only Tier C test — Build drops toward 15%; contingency stays at 5% minimum — rush fees still happen on rental graphics.
What does not shift: booth space should stay inside the CEIR 25–35% band unless you are attend-only with no booth. If your model shows 60% booth space, stop — you are budgeting like an organizer invoice, not an exhibitor program.
Pre-show budget checklist
- All ten line items populated — no blank rows before finance sign-off
- Booth space between 25–35% of all-in total (CEIR check)
- Tier A/B/C label matches calendar tier expectations
- Contingency line at 5–10% — not folded into build or travel
- ROI denominator matches this spreadsheet — see ROI formula
- Candidate fair shortlisted on ExhibitionsVoice with organizer profile reviewed
FAQ
What should be included in a trade show budget?
Booth space, build or rental, freight and drayage, labor, travel and hotels, pre-show marketing, show services (electrical, internet), lead capture, post-show follow-up, and 5–10% contingency. CEIR benchmarks booth space at 25–35% of that total — the rest is non-negotiable for an accurate all-in model.
What percentage of a trade show budget is booth space?
Roughly 25–35% per CEIR. If booth space exceeds 40% of your spreadsheet, you are likely missing freight, labor, travel, or follow-up lines. Rebalance before finance approval.
How much should I budget for a 10×10 trade show booth all-in?
Tier C validation: $18,000–$28,000. Tier B regional: $18,000–$45,000. Tier A flagship: $50,000–$150,000+. Percentage splits stay in the same bands; dollar amounts scale with show tier, geography, and staff count.
How do you create a trade show budget?
Assign a Tier A/B/C label, set a 10×10 all-in ceiling, allocate each line item within the percentage bands in the master table, add contingency last, and submit the one-page model before signing the organizer contract. Plug the same total into your ROI denominator.
What is a good contingency for a trade show budget?
5–10% of all-in spend. Rush graphics, relabelled crates, hotel rebooks, and overtime labor appear on nearly every show week. Contingency is historical accuracy — not padding for finance to cut first.
How is this different from a trade show hidden costs list?
Hidden costs articles flag invoices teams forget — drayage, union labor, scanner licenses. This budget breakdown assigns every category a percentage band and dollar range in one finance-ready table. Use hidden costs to audit gaps; use this page to build the model from zero.
The all-in budget table (line items and % splits)
CEIR puts booth space at 25–35% of total exhibit spend. The remaining 65–75% splits across build, freight, labor, travel, pre-show marketing, show services, lead capture, follow-up, and contingency. This page is the allocation template — not a size comparison.
Tier A/B/C totals for a 10×10 footprint
Same footprint, three calendar tiers from our Tier A/B/C framework: Tier C validation ($18k–$28k all-in), Tier B regional ($18k–$45k), Tier A flagship ($50k–$150k+). Dollar splits scale with tier; percentages stay in guardrail bands.
How this differs from our other budget guides
By size: see average booth cost breakdown (10×10 vs 10×20 vs 20×20). Forgotten invoices: see hidden costs checklist (mistake list). Single headline number: see all-in exhibit cost guide. This page is the spreadsheet structure finance approves.
Connect budget to ROI
Once all-in totals are locked, plug the same denominator into our trade show ROI formula. Shortlist candidate fairs on ExhibitionsVoice before you assign tier labels.
Common exhibitor questions
What should be included in a trade show budget?
Booth space, build or rental, freight and drayage, labor, travel and hotels, pre-show marketing, show services (electrical, internet), lead capture, post-show follow-up, and 5–10% contingency. CEIR benchmarks booth space at 25–35% of the total.
What percentage of a trade show budget is booth space?
Roughly 25–35% per CEIR. If booth space exceeds 40% of your model, you are likely missing freight, labor, travel, or follow-up lines.
How much should I budget for a 10x10 trade show booth all-in?
Tier C validation: $18,000–$28,000. Tier B regional: $18,000–$45,000. Tier A flagship: $50,000–$150,000+. Percentage splits stay similar; dollar amounts scale with show tier and geography.
How do you create a trade show budget?
Assign a Tier A/B/C label, set a 10×10 all-in target range, then allocate each line item within the percentage bands. Add contingency last. Submit the table to finance before signing the organizer contract.
What is a good contingency for a trade show budget?
5–10% of all-in spend. Rush graphics, relabelled crates, hotel rebooks, and overtime labor hit on nearly every show week — contingency is historical accuracy, not padding.
How is this different from a trade show hidden costs list?
Hidden costs articles flag invoices teams forget. This budget breakdown assigns every category a percentage band and dollar range so finance approves one complete model — not a booth quote plus surprises.
Editorial standards & corrections
This guide is maintained by the ExhibitionsVoice editorial team. We cross-check dates, venues, and organizer names against official sources before listing events. Spot an error? Use our contact form with the event URL and corrected details — every correction request is read by editorial.
Read more: About ExhibitionsVoice · FAQs · All exhibitor guides
Related articles
Oil and gas trade shows 2026: energy calendar and how to pick
Oil and gas trade shows for 2026 — ADIPEC, WETEX, and offshore energy fairs we score for NOC, IOC, and energy-tech exhibitors.

CPHI India 2026 exhibitor guide: Delhi pharma ingredients floor
CPHI India 2026 exhibitor guide for 23-25 November at IICC Yashobhoomi, New Delhi — API, CDMO, and packaging teams scoring South Asia's ingredients floor.

Fintech trade shows 2026: payments calendar and how to pick
Fintech and payments trade shows for 2026 — Money20/20 USA, Sibos, and how banks and vendors pick Tier A/B/C money-ecosystem floors.
ADIPEC 2026 exhibitor guide: Abu Dhabi energy floor
ADIPEC 2026 exhibitor guide for 2-5 November at ADNEC Centre Abu Dhabi — who should exhibit, hall logistics, and how we score the energy floor.